
I built a model to predict March Madness
I built a model to predict March Madness
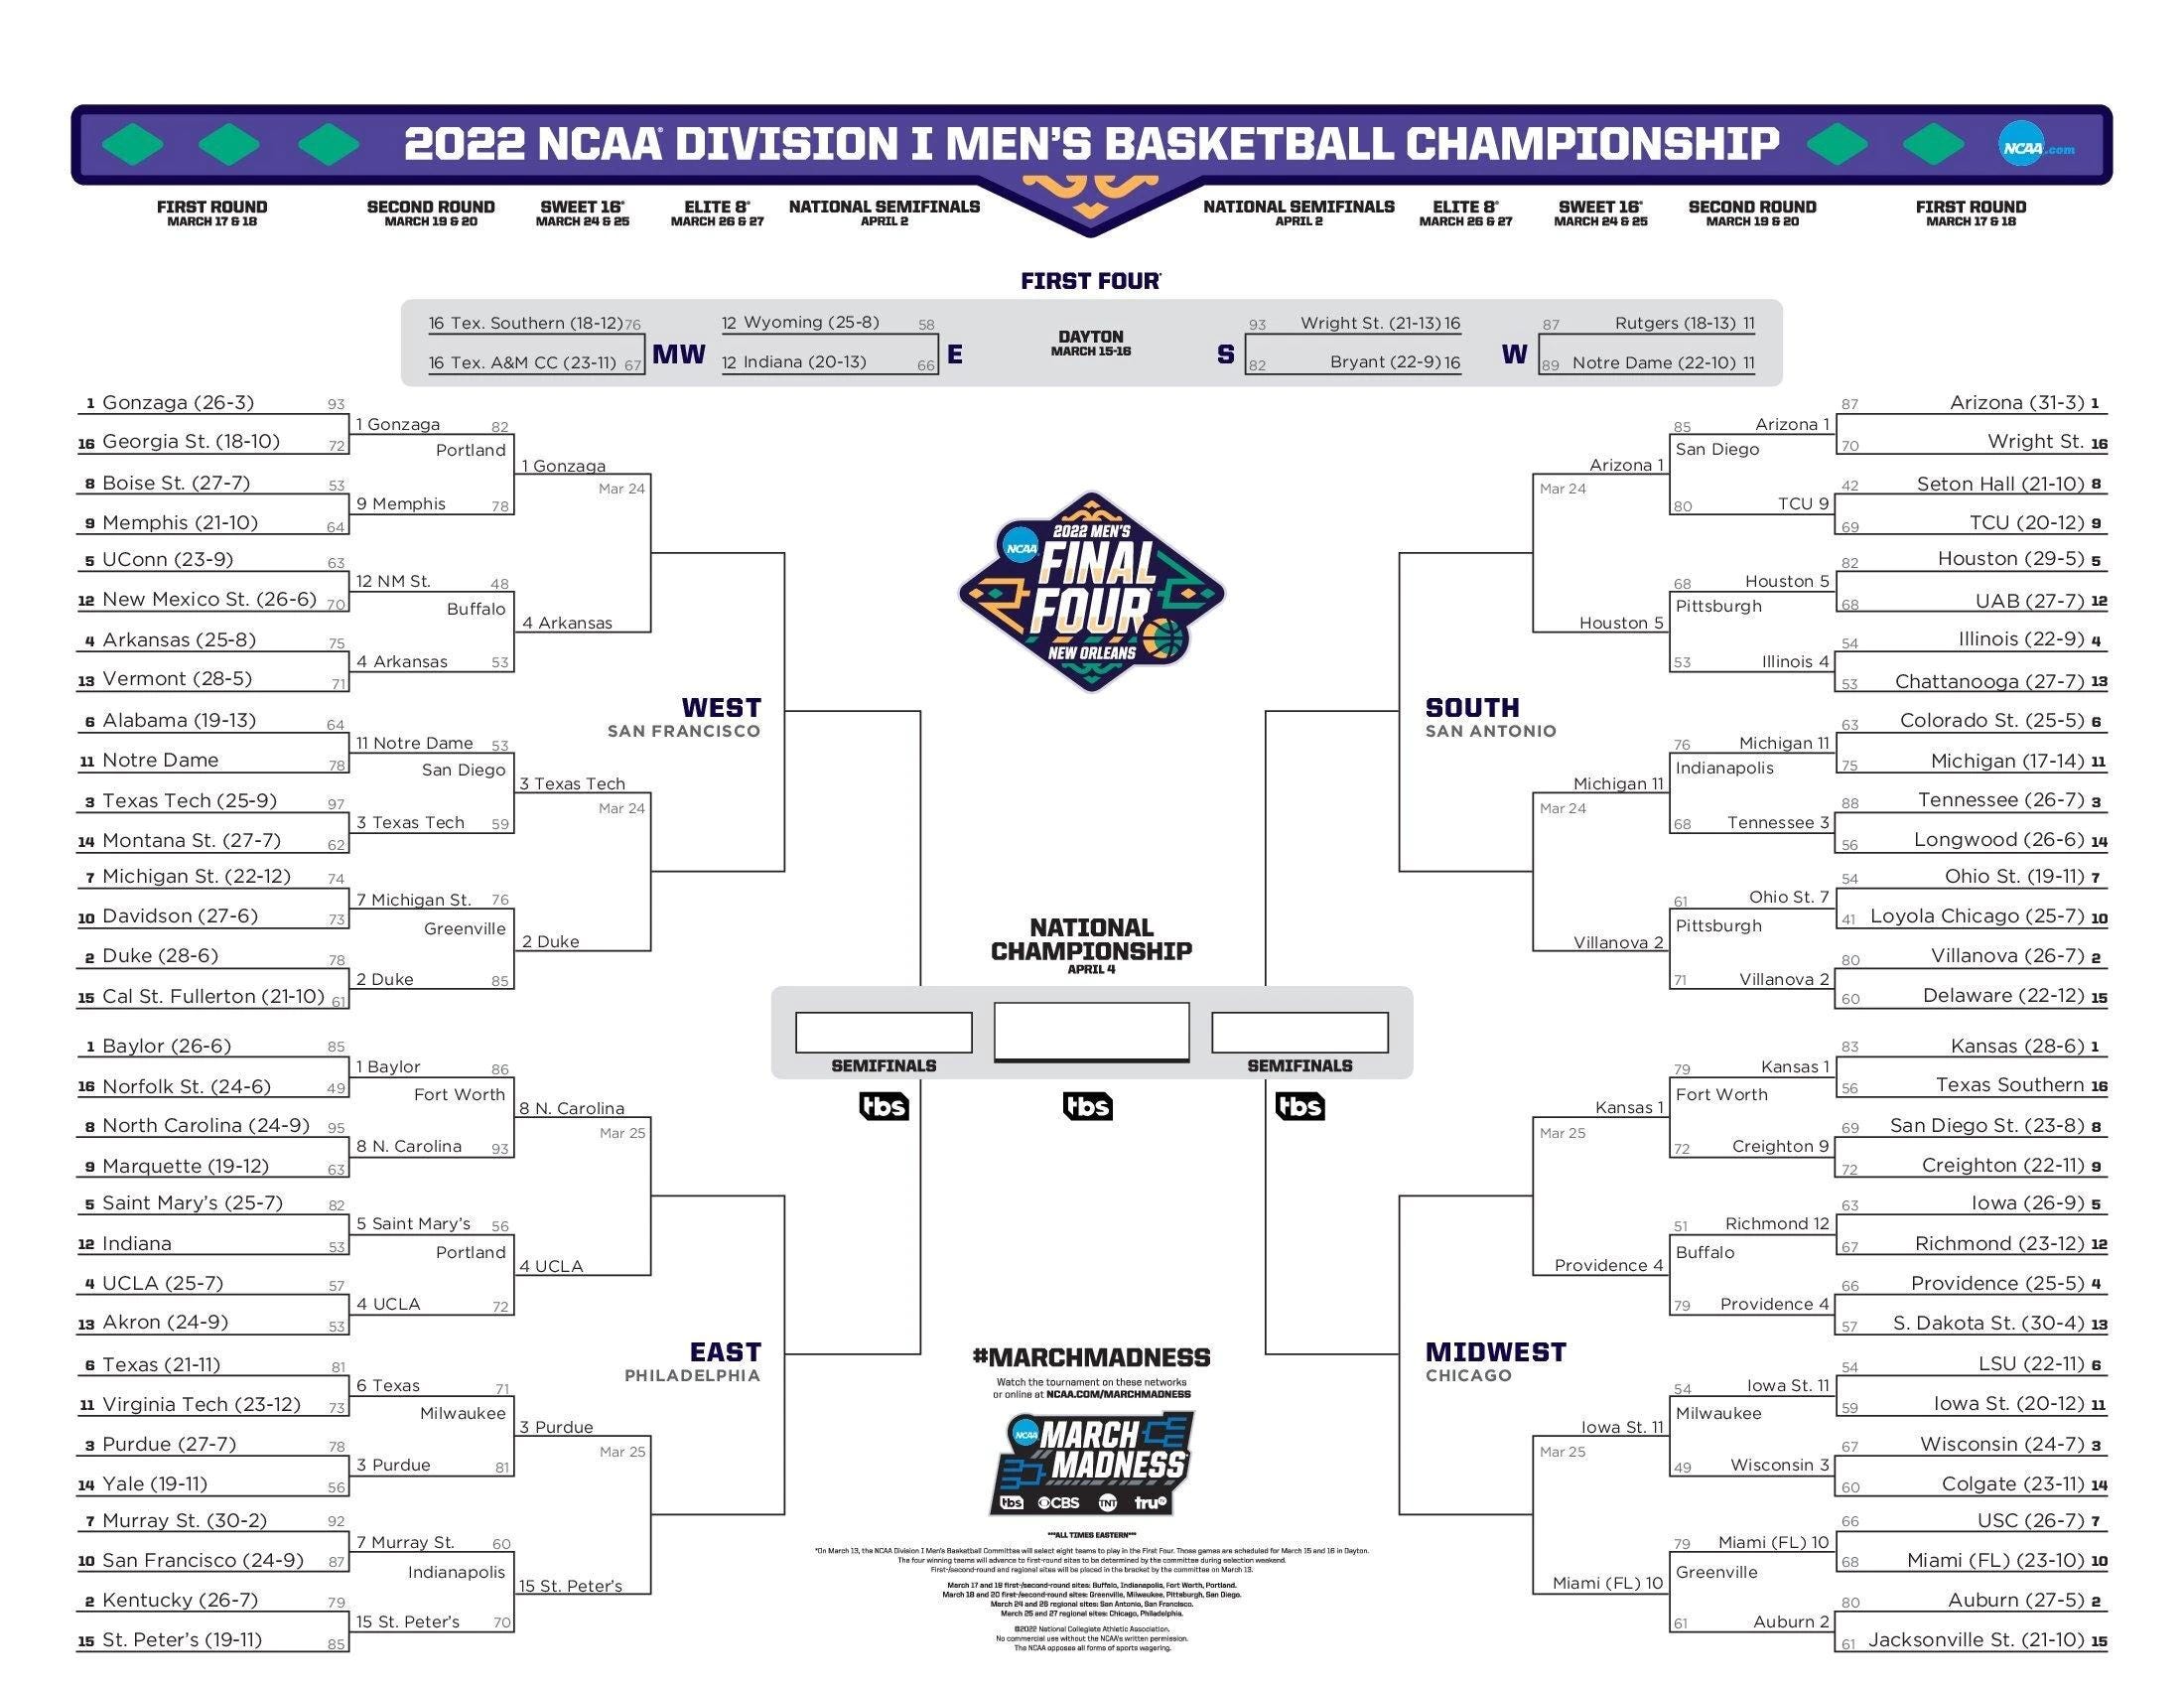
And it went 29/32 in first round matchups


March is one of my favorite times of the year. Spring is in the air, basketball is on TV, and chicken wings are on my plate. A combination in perfect harmony.
Kicking off last week along with the annual men’s and women’s collegiate post season basketball tournaments were 10’s of millions of brackets attempting to pick 63 winners. And 10’s of millions more hours of head scratching to do so. The odds of predicting a perfect bracket are 1 in 9 quintillion (9x10^18) possibilities, which is more than the number of grains of sand on earth (7.5x10^18). If you have some basketball knowledge odds increase all the way to 1 in 120 billion. About a thousand times less likely than winning the Powerball (1 in 175 million). And yet each year many of us… try.
Knowing this and my previous history with fantasy sports, bracket filling, and sports betting, I wondered if I could use math to help build my bracket. I reasoned that I could put the things I had learned in school finally to good use!
This blog post will take you through the process. It’s not as theoretical as some of the other posts, but economics is a field accustomed to working with models. And a little math isn’t too painful. :)
The model
Although it would be useful to predict continuous or integer level variables, such as final scores for each team (to bet under/over lines or spreads), these are much harder forecast accurately. Additionally, it would take a fair amount of analysis and tinkering to create a decent model. Instead, I was only concerned with the winner and loser of each matchup, in order to fill out my bracket and have the best chance of winning. That is, each data point, a game, could be grouped into one of two categories, a win or a loss.
When attempting to build a model to fit data to a binary (true or false, win or lose) variable, or series of categories, one simple way to do so is a logistic regression. The idea is that since there are only two outcomes, win or lose, a linear fit through the data would give impossible results. (See the image below at low values of x the prediction is less than 0, where “p” is the probability of success. A negative probability of success is nonsensical.)

Typically logistic regression models are used as baseline models. To create more advanced models that may be more accurate, one could add Bayesian priors, or create decision tree, neural net, or support vector machine models.
Additionally, it may be the case that the data could be further broken into sub categories such as a big win, narrow win, narrow loss, or big loss with game lines to demarcate big and narrow. This would require the use of a multinomial logistic regression model, or one of the ML models listed above.
The data
The data used in the model was taken from historical tournament outcomes, and advanced basketball statistics from KenPom. These advanced statistics normalize offensive and defensive efficiency per opponent and per possession (each time a team has the ball.) KenPom has been tracking these statistics since 2002, and has risen to fame by sports fans and industry experts alike. He has previously worked with Daryl Morey of the Houston Rockets and now Philadelphia 76ers, who is known to use advanced statistics when constructing his professional squads.
For each game, both teams’ KenPom data were merged to a dataframe with their name and seed (place within the tournament) to create the x variables for the model. The y variable was taken to be 1 or 0 to indicate a win or loss (labeled x and y in my code.)
One of the deficiencies of using this data is the fact that these are final statistics which incorporate tournament games played. But, they are being used to compare games within the tournament. So to some degree the matchup is already added into these statistics, but are not for the ultimate use case of the model which incorporates data up until the tournament. Since week-by-week KenPom rankings are not available dating back to 2002, we will have to settle for this inconsistency.
The results
Splitting the data into training and test sets, then testing for the accuracy of the model, it is able to predict correctly the outcome of about 89% of the first round of games. Not too bad! But how did it stack up to the ultimate test? Predicting the first round of the actual 2022 NCAA men’s basketball tournament?
It picked 29/32 correct winners. Or, 90% accuracy :)
After the first round of the tournament the model was ranked 443 out of the more than 17 million entries submitted to ESPN.
After the round 2 however, it dropped to rank 110,055, picking a measly 9/15 winners (Kentucky was picked to win again in round 2 so it also got that wrong.)
What happened? I attribute the second round lack of success to potential mismatches with data selection, and factors outside of the model.
Data selection
Why did the second round fare much worse than the first? It’s possible that the amount of data became an issue. For each year in each of the 4 subcategories or regions of the bracket, a 1 seed matches up with a 16, a 2 with a 15... and so on. When the 2nd round happens however, the number of possibilities of matchups expands. A 2 seed might play a 10 or a 7 seed. So the model, when faced with this possibility, has less data to train on. Potentially leading to error.
Another possibility is some of the data read by the model is too old to be applicable. The game of basketball in 2022 is surely different than in 2002 (recently the 3 point arc was pushed back since 3 point attempts became so prevalent) and so it might not make sense to build a model for 2022 using data from 2002.

Factors outside the model
Commonly termed “omitted variable bias” there are sometimes variables which have an impact on the process that are external to the model. The KenPom data doesn’t account for things like conference tournament wins, current win or loss streak, injuries, or travel. For example, Baylor and Wisconsin, two teams predicted to win but did not, suffered key injuries which may have influenced the outcome. It remains to be seen if this data could be included in the model as well.
Another possibility is just luck. Just because the model is trained to XX% accuracy, doesn’t guarantee that it will be XX% accurate in its forecast. There are many sources of uncertainty after all.
So… what?
I’ve gone through the process of what the model is, how it performed (so far) and what could be done better. What can we take away from this exercise?
Sometimes, blindly following a model can be helpful.
I was surprised at how well the model was able to predict 8 v 9 seed matchups (4/4), 7 v 10 matchups (3/4), and 6 v 11 matchups (4/4). These are notoriously tricky to predict.
Sometimes, blindly following a model can be not helpful.
Looking beyond the first two rounds, 3/4 final four teams have been eliminated so far, including the predicted national champion Wisconsin. This raised my eyebrows when I saw that Wisconsin was the models pick, and Vegas would also have been very surprised to see the Badgers win the title (+7000 odds at the start of the tournament.) I’m not sure exactly what was happening here and would require further analysis to find out.
Models are only as good as you train them to be
Generally, if a forecasting model has seen a scenario before it is good at guessing the outcome. But this breaks down in a situation where it hasn’t seen before. And of course, the future is constantly changing and evolving, increasing the chances that a situation will occur that the model has not seen. Basically, the models are playing catchup with reality. Bayesian statistics tries to get around this a bit by implementing “priors” or ideas about what the future should look like, but no model will be able to predict with 100 percent accuracy.
This is true with every decision we face in life. Whether using a model or not, we should probably not blindly follow an algorithm or rule of thumb, no matter how useful they may be. And when we do, to have good outcomes we have to have good inputs. To borrow from chemical engineering, garbage in = garbage out.
Wishing you the best of luck with your brackets, and I’ll try again next year to do better than 90% :)
P.S. If you want to take a peek at the code, it’s posted to my GitHub. It’s not the neatest, but should be readable enough