
Instruments in Economics
Instruments in Economics
An example with the Great Texas Freeze and SNAP benefits


When I was growing up I tried playing a few different instruments. I took a few piano and guitar lessons, and was a part of the “percussion” section of the middle school band class. I’ve always liked music, and discovering new and interesting sounding artists, but actually playing music didn’t come very naturally to me. Maybe my brain is too analytical, I would easily get discouraged even if I pressed the wrong key once or couldn’t get all the sounds out of a chord. Nevertheless, the point in writing this isn’t to lament my lack of potential as a musician, but to talk about another instrument. That is, what’s known in economics as an Instrument Variable.
I’m sure most of us are familiar with the the iconic “Supply = Demand” graph taught in Econ 101.

When attempting to create these supply and demand curves in practice, one ends up with equations that look something like this:
Using some simple algebra you can get an expression for Q supplied in terms of Q demanded.
At the market clearing price we say that supply = demand, solve for Q and then we’re done! But in order to draw the rest of the curve, we can’t assume supply is equal to demand, and so we’re left with trying to estimate Quantity supplied and Quantity demanded in isolation. Both are functions of the price, but as you can see, they influence each other. This is intuitive, if you’re a business selling bananas, you wouldn’t want to produce a million bananas to try to then sell to a town of 100 people. (Unless each plans to eat 10,000 bananas!)
So we can’t just collect data on prices, and collect data on quantities produced, and call it a day. This phenomenon is known as simultaneity, where X causes Y but Y also causes X, or the variables are determined simultaneously. For the econometric wonks out there, this is equivalent to a nonzero covariance between the regressor and error term, which violates an assumption of OLS! This is difficult to demonstrate because the model is built to make the error terms here average to 0 conditional on X, so this problem is hidden within the model.
A workaround to this would be to use an instrument variable. It works by affecting X, but not directly affecting Y. Such causal pathway might look something like
Where X and Y can affect each other, but Z only affects X which would then affect Y.
Usually instrument variables become clearer with an example.
Say you’re interested in studying the relationship between the number of hours worked and SNAP benefits. It’s possible that if you increase the number of hours that you work (if you are paid hourly and say you get a promotion from part time to full time work), you increase your income and therefore end up not qualifying for SNAP benefits any longer. However, if you’re receiving income from SNAP it might discourage you from working and instead you might choose to trade your labor for leisure and work fewer hours and maintain snap benefits.
This is of particular concern for designing incentives around work. If income incentives are tied to how much you work, then tax-payers may be worried that they are subsidizing low income earners to work less. And similar to the general example above, it isn’t straight forward to test just a relationship between hours and SNAP benefits since each may affect each other.
But if there was another variable, that caused an outside increase in hours worked, which in turn led to a decrease in SNAP benefits, one might be able to study the effectiveness of the one way relationship between hours worked and SNAP.
Such a variable could be what I experienced in February 2021, or as I like to call it The Great Texas Freeze.
")
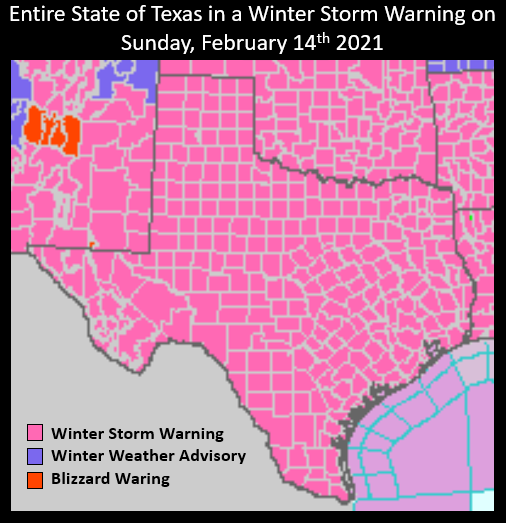
During this time millions of Texans lost power, pipes froze, and fortunately for me personally, my biggest problem was trying to find spare water bottles. Over 200 people died and soon afterwards the temperatures rose, and things needed to be repaired. This led to a jump in the number of hours worked

And initially an increase in the number of SNAP benefits recipients, followed by a decrease afterwards.

You can see there isn’t much of a relationship between the two when graphed against each other.

I couldn’t quickly find a time series of the low temperature in Texas, but with this (and perhaps a series of controls) one would be able to quantify the impact of working more on SNAP benefits (ideally this time series should extend past June 2021 to see the further impact of higher working hours). But what this impact would be measuring is a Local Average effect. That is, the effect of people working more due to the low temperatures. If people were working a lot regardless if there were cold temperatures or not, or if they weren’t working despite the cold or not, then this effect wouldn’t apply to them.
This seems a bit weird right? Low temperatures are causing a decrease in SNAP recipients? This just sounds strange. And that’s a good thing! A “smell test” of a good instrument is that it should feel weird. That low temperatures aren’t directly causing the decrease in SNAP recipients, there’s nothing in the legislation that says SNAP depends on temperature. Only through the mechanism of people working more to repair damages caused by the low temperatures does it affect SNAP.
I also should add that there are two other assumptions, Relevance- that there is a correlation between temperature lows and hours worked in the first place, and excludability- that there isn’t a covariance between the instrument variable and error term. That the assignment of low temperatures wasn’t inherent to the number of SNAP recipients. This seems plausible, but it could be the case that relatively poorer parts of Texas experienced warmer temperatures or vice versa, namely Houston which could potentially have a large number of SNAP recipients didn’t experience as extreme temperatures as other parts of the state.
More generally, instruments can be used to combat common problems in economics like simultaneity, measurement error and omitted variable bias. These are particularly tricky problems, and the problem of simultaneity is often misunderstood in the sense that we are used to thinking about cause and effect in one direction. Simple, no problem. Unfortunately, uncovering cause and effect in decision making is rarely simple and one directional, and studying economics helps to understand these relationships.